

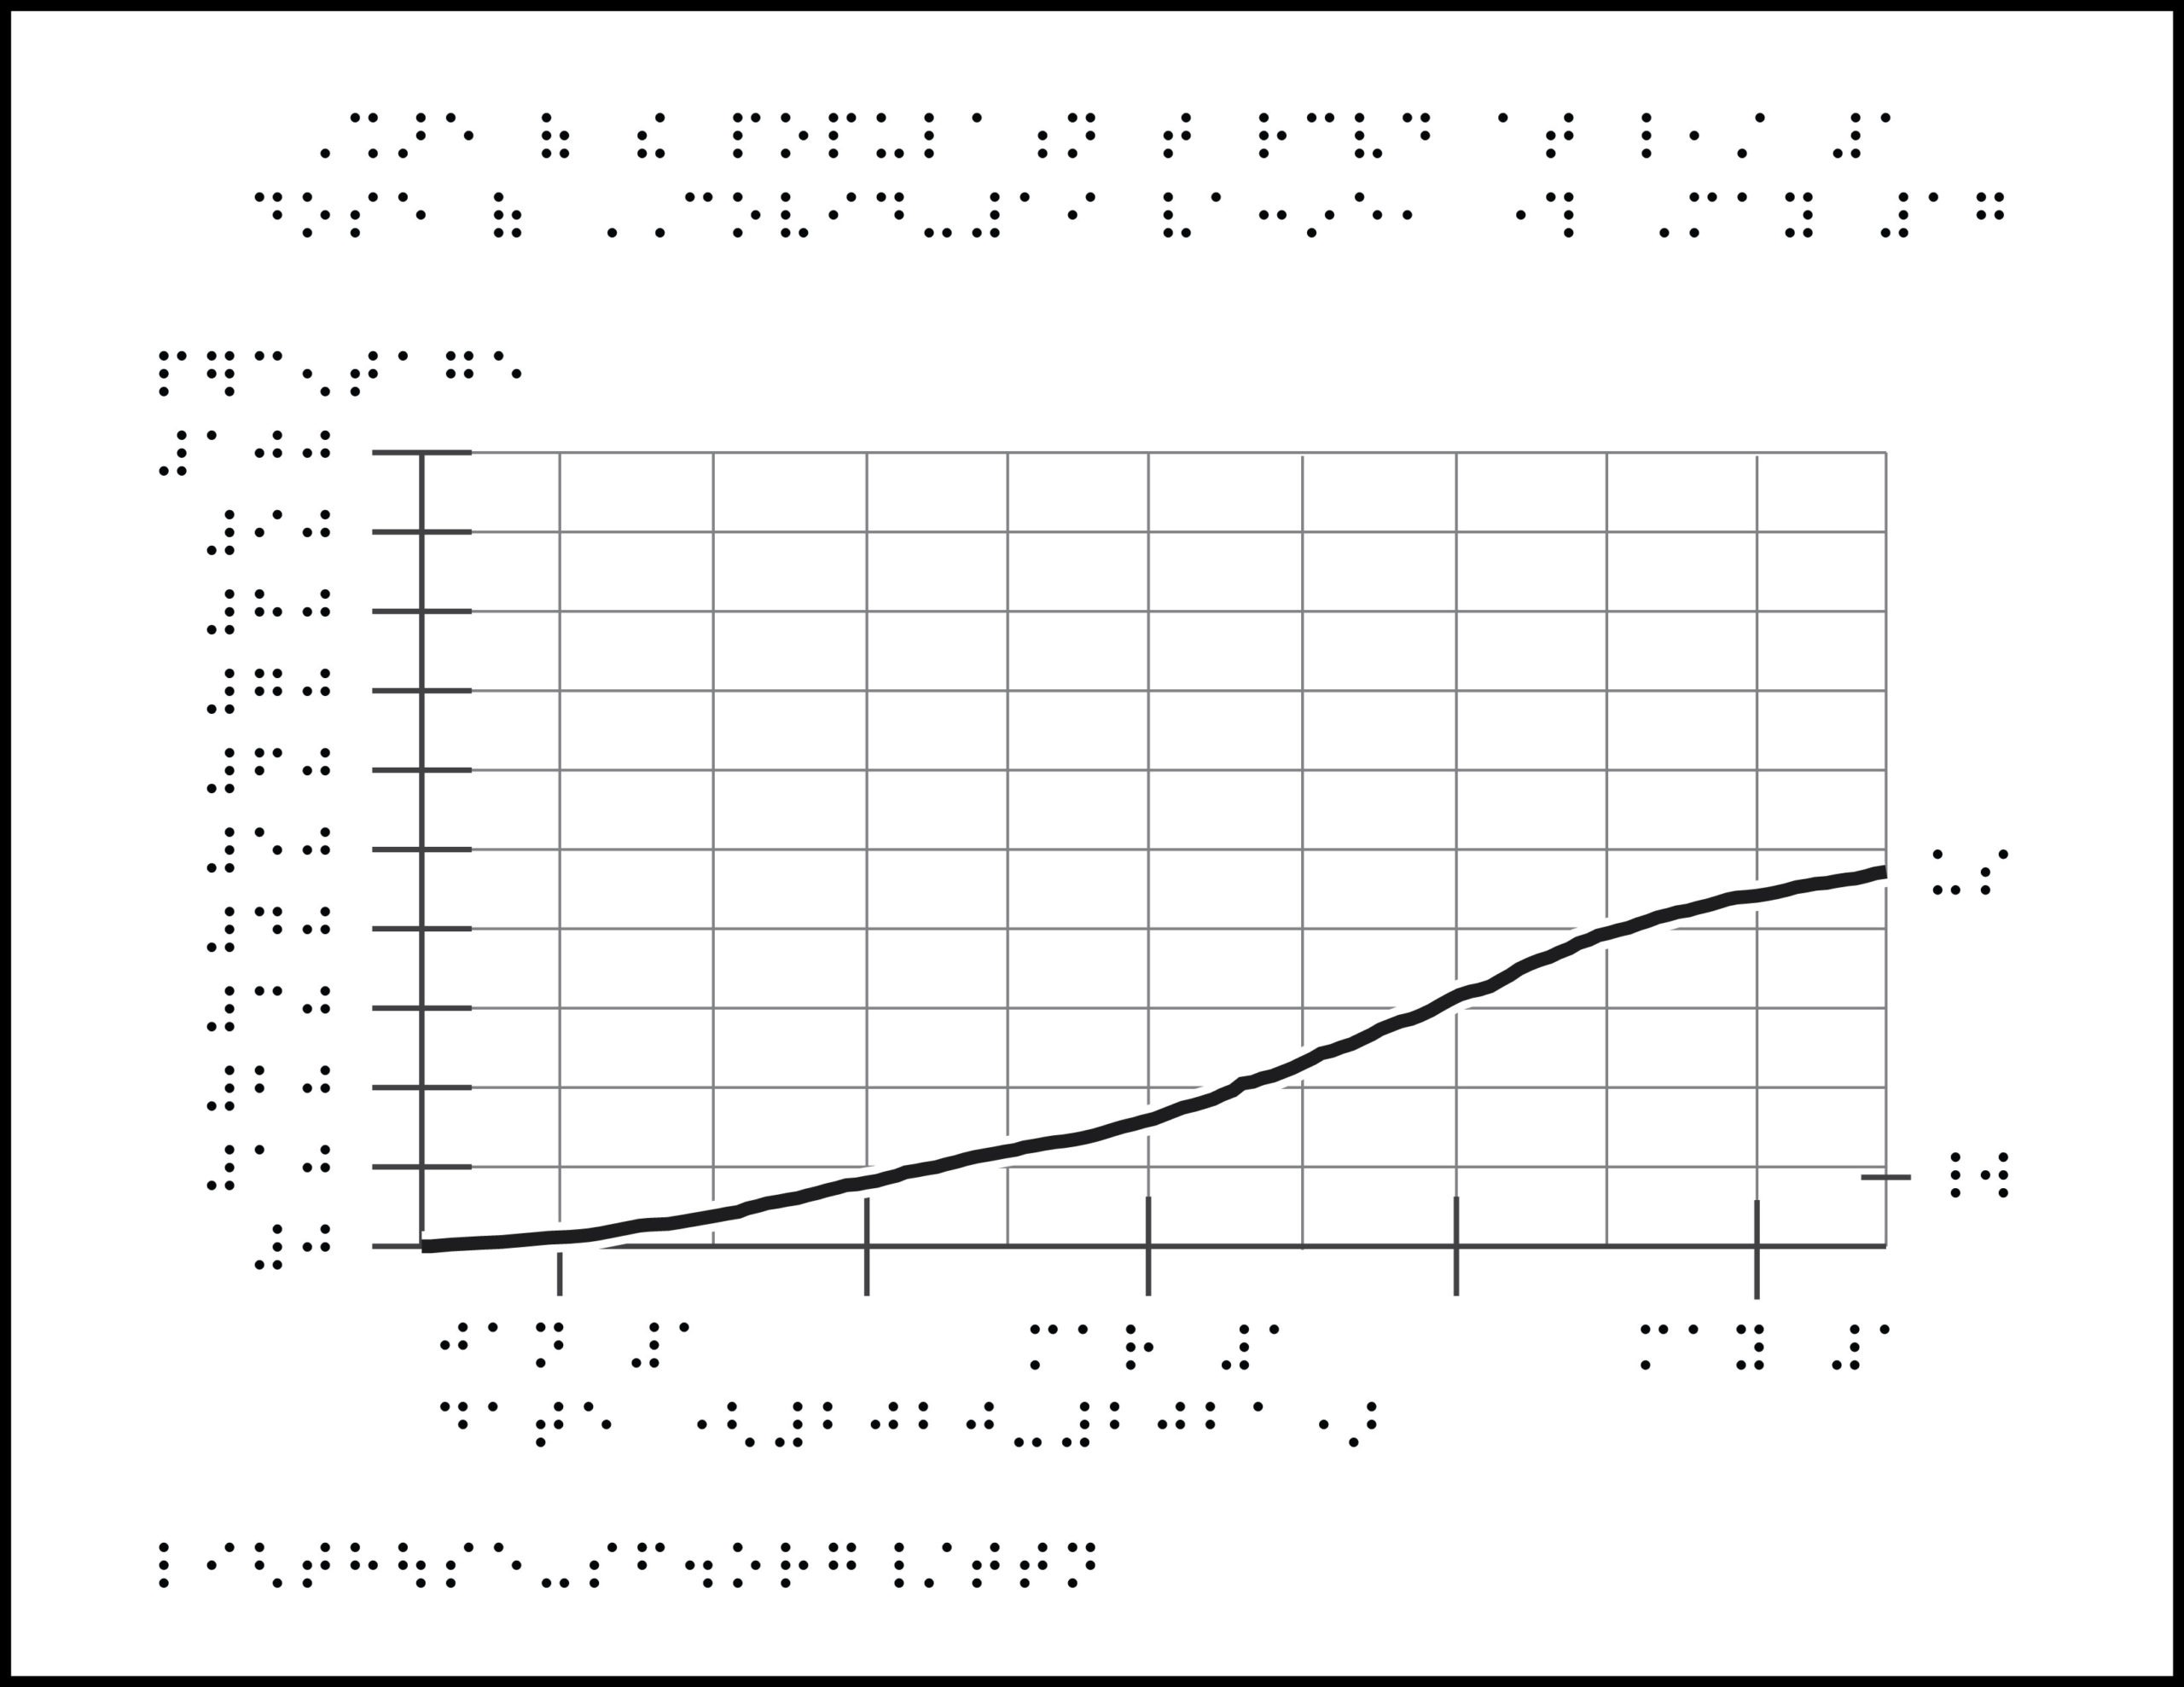
Tactile graphic title: Share of the population that received at least 1 dose of COVID-19 vaccine, through May 17
Description: Braille graph with a plotted line increasing from the origin along the x- and y-axes, reaching approximately 47% in mid-May. End of line is labeled “US,” with another tick labeled “world” at about 9%. X-axis is Date (2020-2021) with markers for Jan 1, Mar 1, May 1. Y-axis is Percentage, from 0 to 100. Note that this does not equal percentage fully vaccinated, but rather those who have received at least one dose.
ZIP folder contains files for producing tactile graphics on 8.5 x 11-inch paper, landscape:
- PRN for ViewPlus Columbia / Delta, APH PixBlaster, IRIE BrailleTrac / BrailleSheet;
- PDF for Swell, Microcapsule or PIAF;
- Reference PDF with corresponding large print text (not for tactile production).
Printing Instructions and Supported Embossers
How to unzip/uncompress: Windows 10, Windows 8.1, MacOS.
Source: Our World In Data – Share of population who received at least one vaccine dose, Our World In Data – COVID Vaccinations
Sign up
Sign up to receive tactile graphics files to print at home and surveys to vote on the next week’s tactile graphic.