
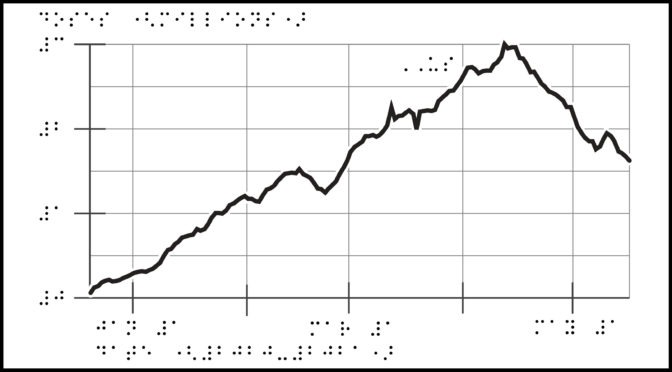
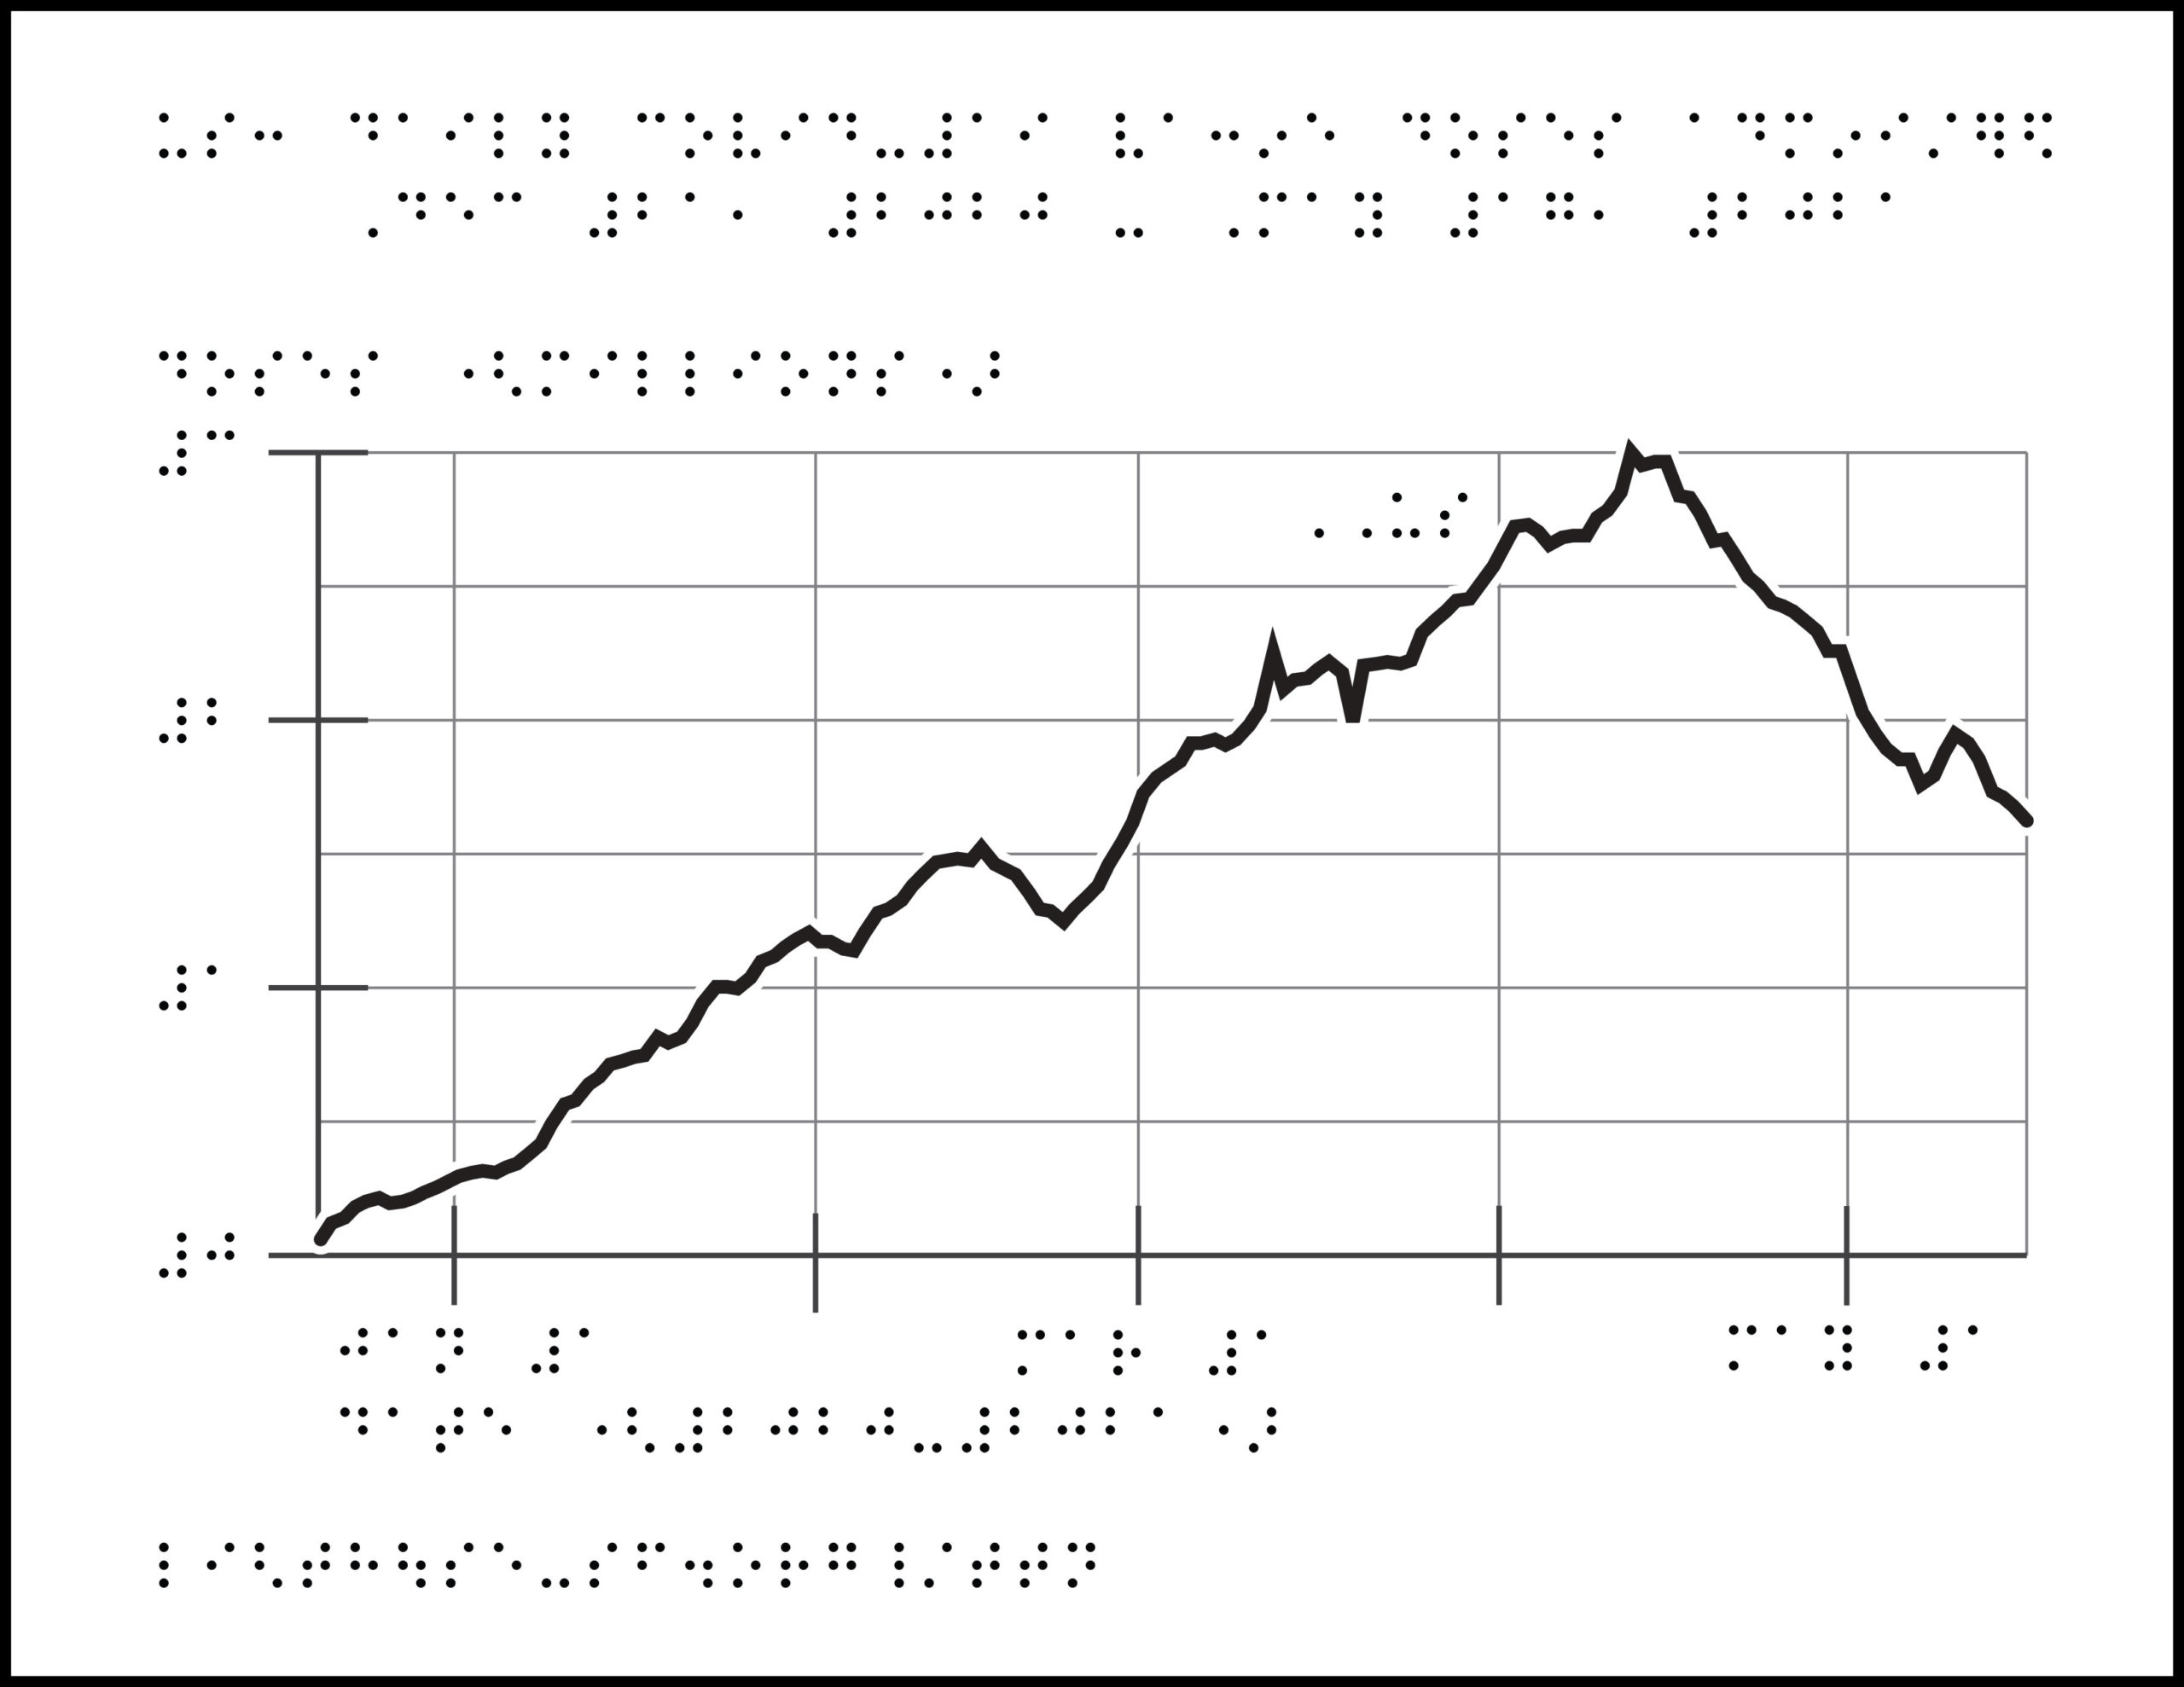
Tactile graphic title: US: Daily COVID-19 Vaccine Doses Administered, Dec 21, 2020 – May 17, 2021
Description: Braille graph with a plotted line increasing along the x- and y-axes, dipping a few times, peaking in mid-April with just over 3 million, then decreasing again. X-axis is Date (2020-2021) with markers for Jan 1, Mar 1, May 1. Y-axis is doses, from 0 to 3 million. Note that this shows number of doses, which may be different than number of people vaccinated, depending on vaccine.
ZIP folder contains files for producing tactile graphics on 8.5 x 11-inch paper, landscape:
- PRN for ViewPlus Columbia / Delta, APH PixBlaster, IRIE BrailleTrac / BrailleSheet;
- PDF for Swell, Microcapsule or PIAF;
- Reference PDF with corresponding large print text (not for tactile production).
Printing Instructions and Supported Embossers
How to unzip/uncompress: Windows 10, Windows 8.1, MacOS.
Source: Our World In Data – US Daily Vaccines, Our World In Data – COVID Vaccinations
Submit Your Ideas and Touch The News
Sign up
Sign up to receive tactile graphics files to print at home.