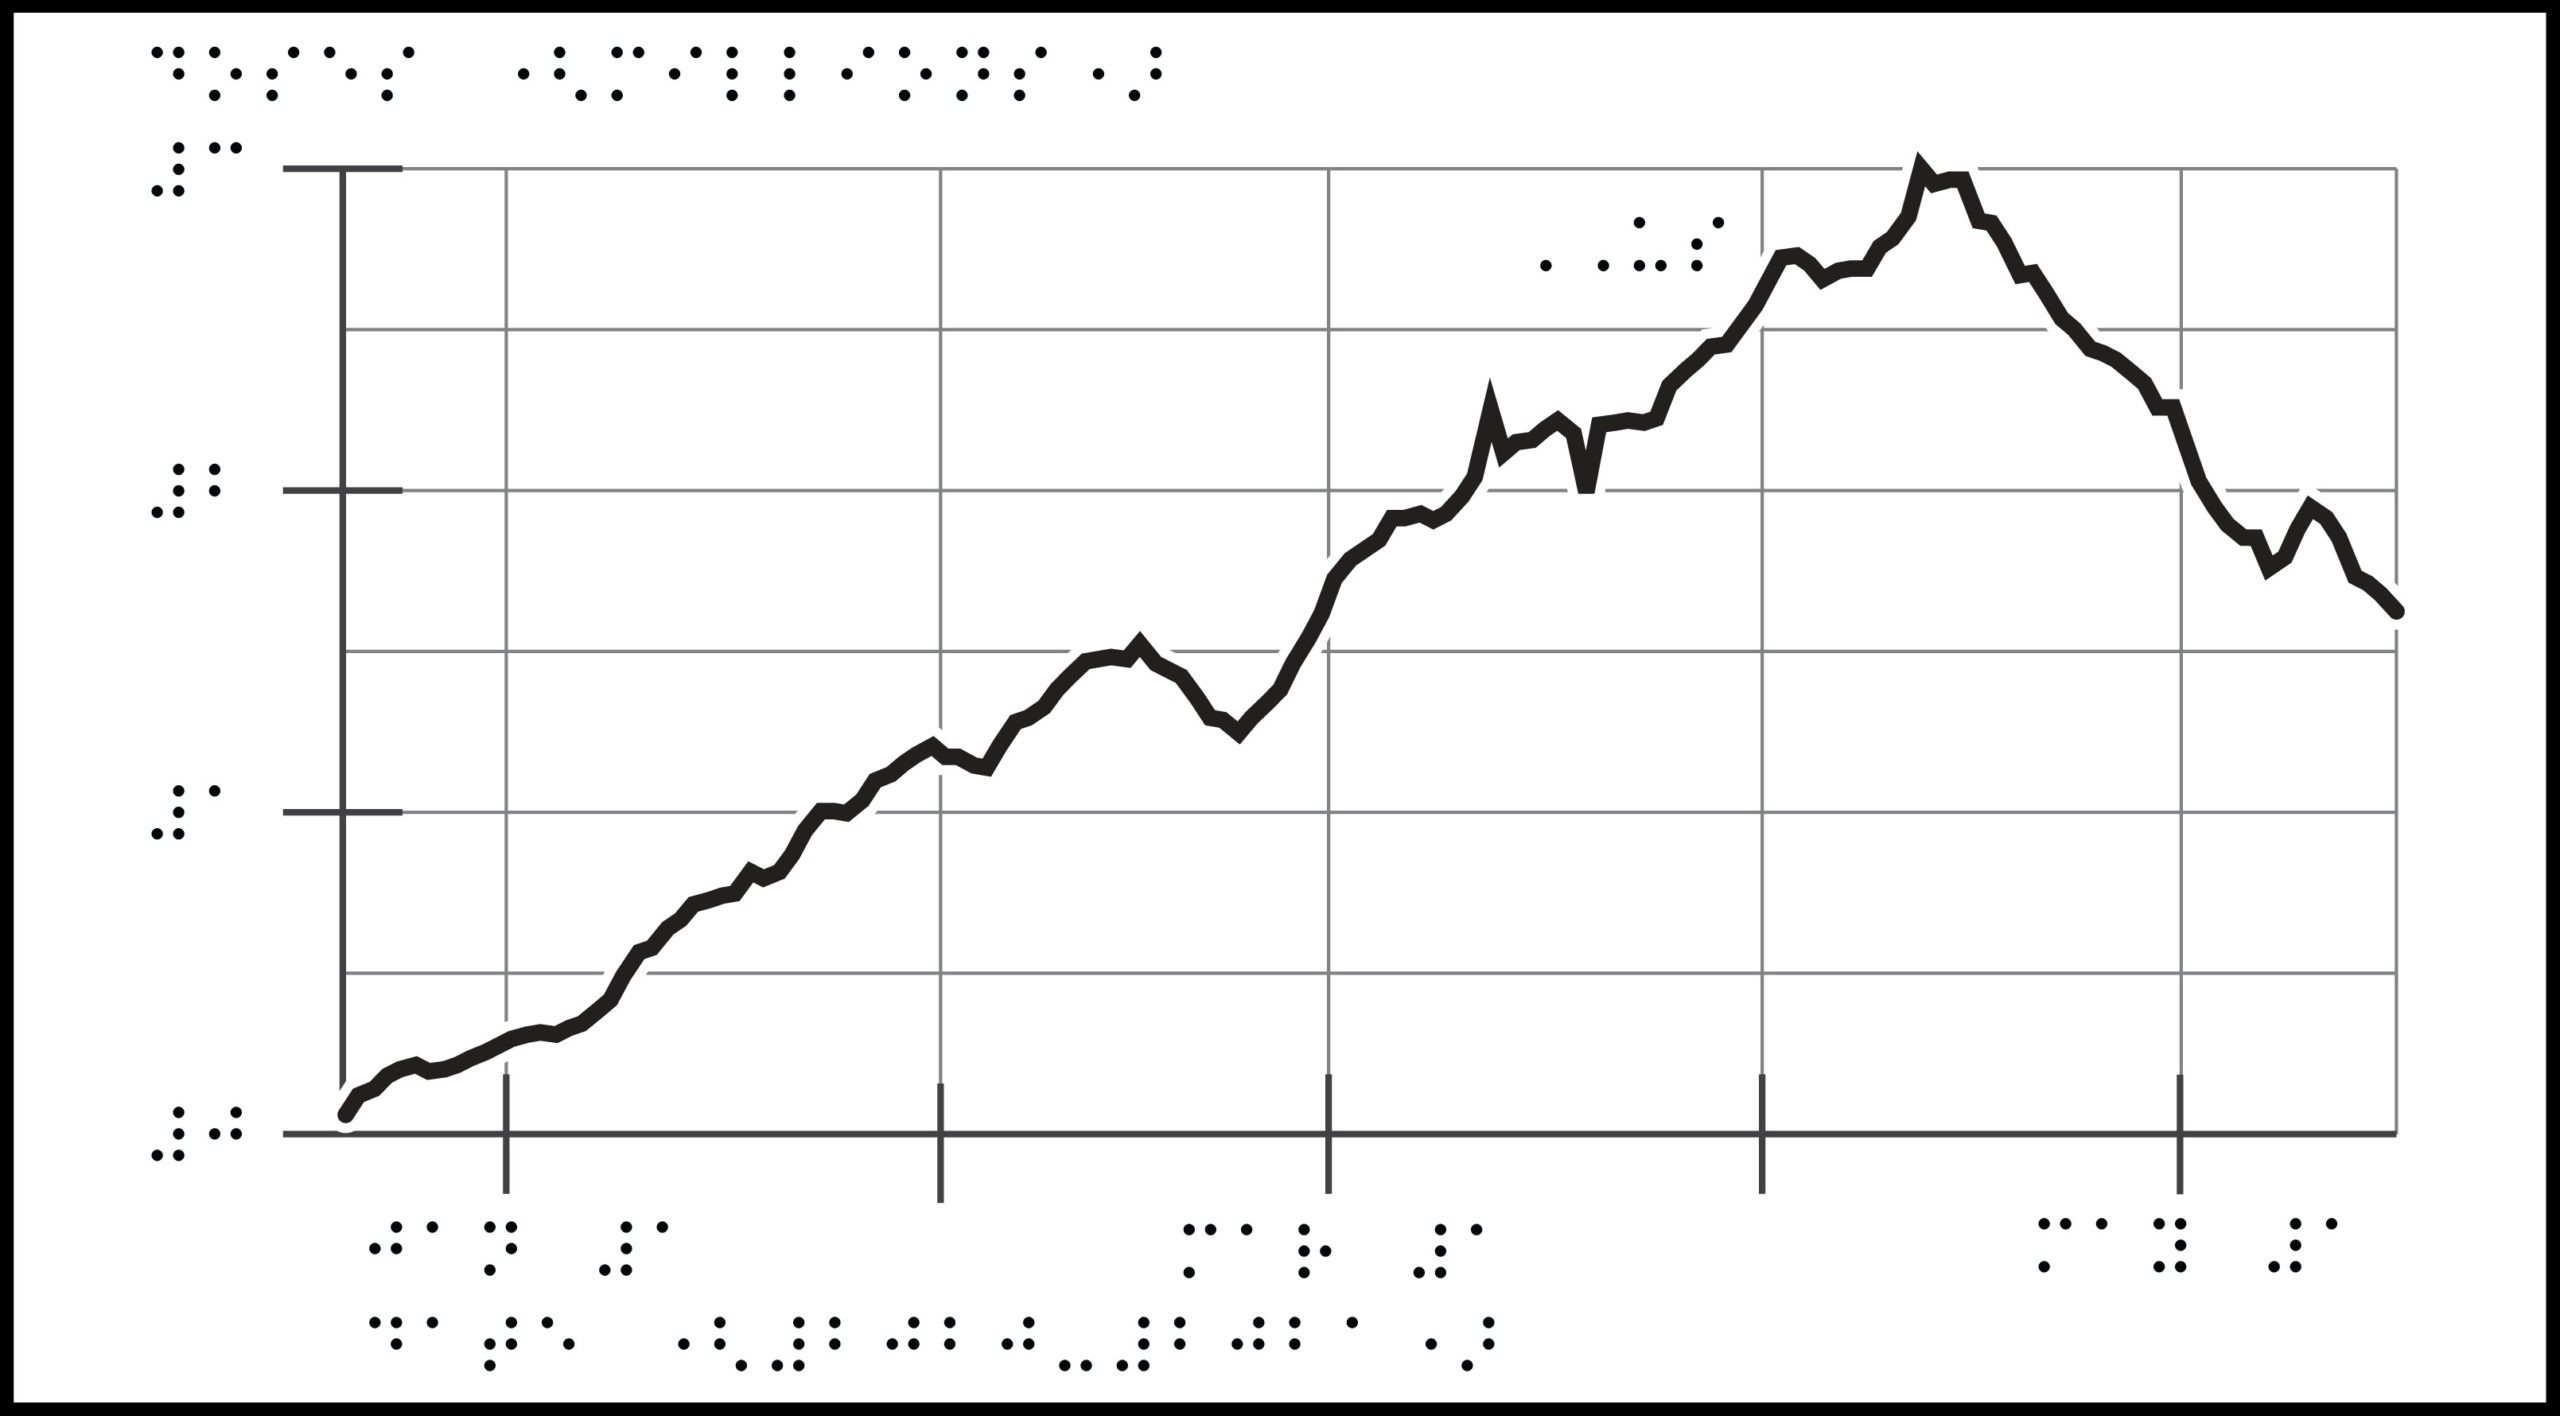
How many COVID-19 vaccine doses have been administered in the US?
Tactile graphic title: US: Daily COVID-19 Vaccine Doses Administered, Dec 21, 2020 – May 17, 2021
Description: Braille graph with a plotted line increasing along the x- and y-axes, dipping a few times, peaking in...