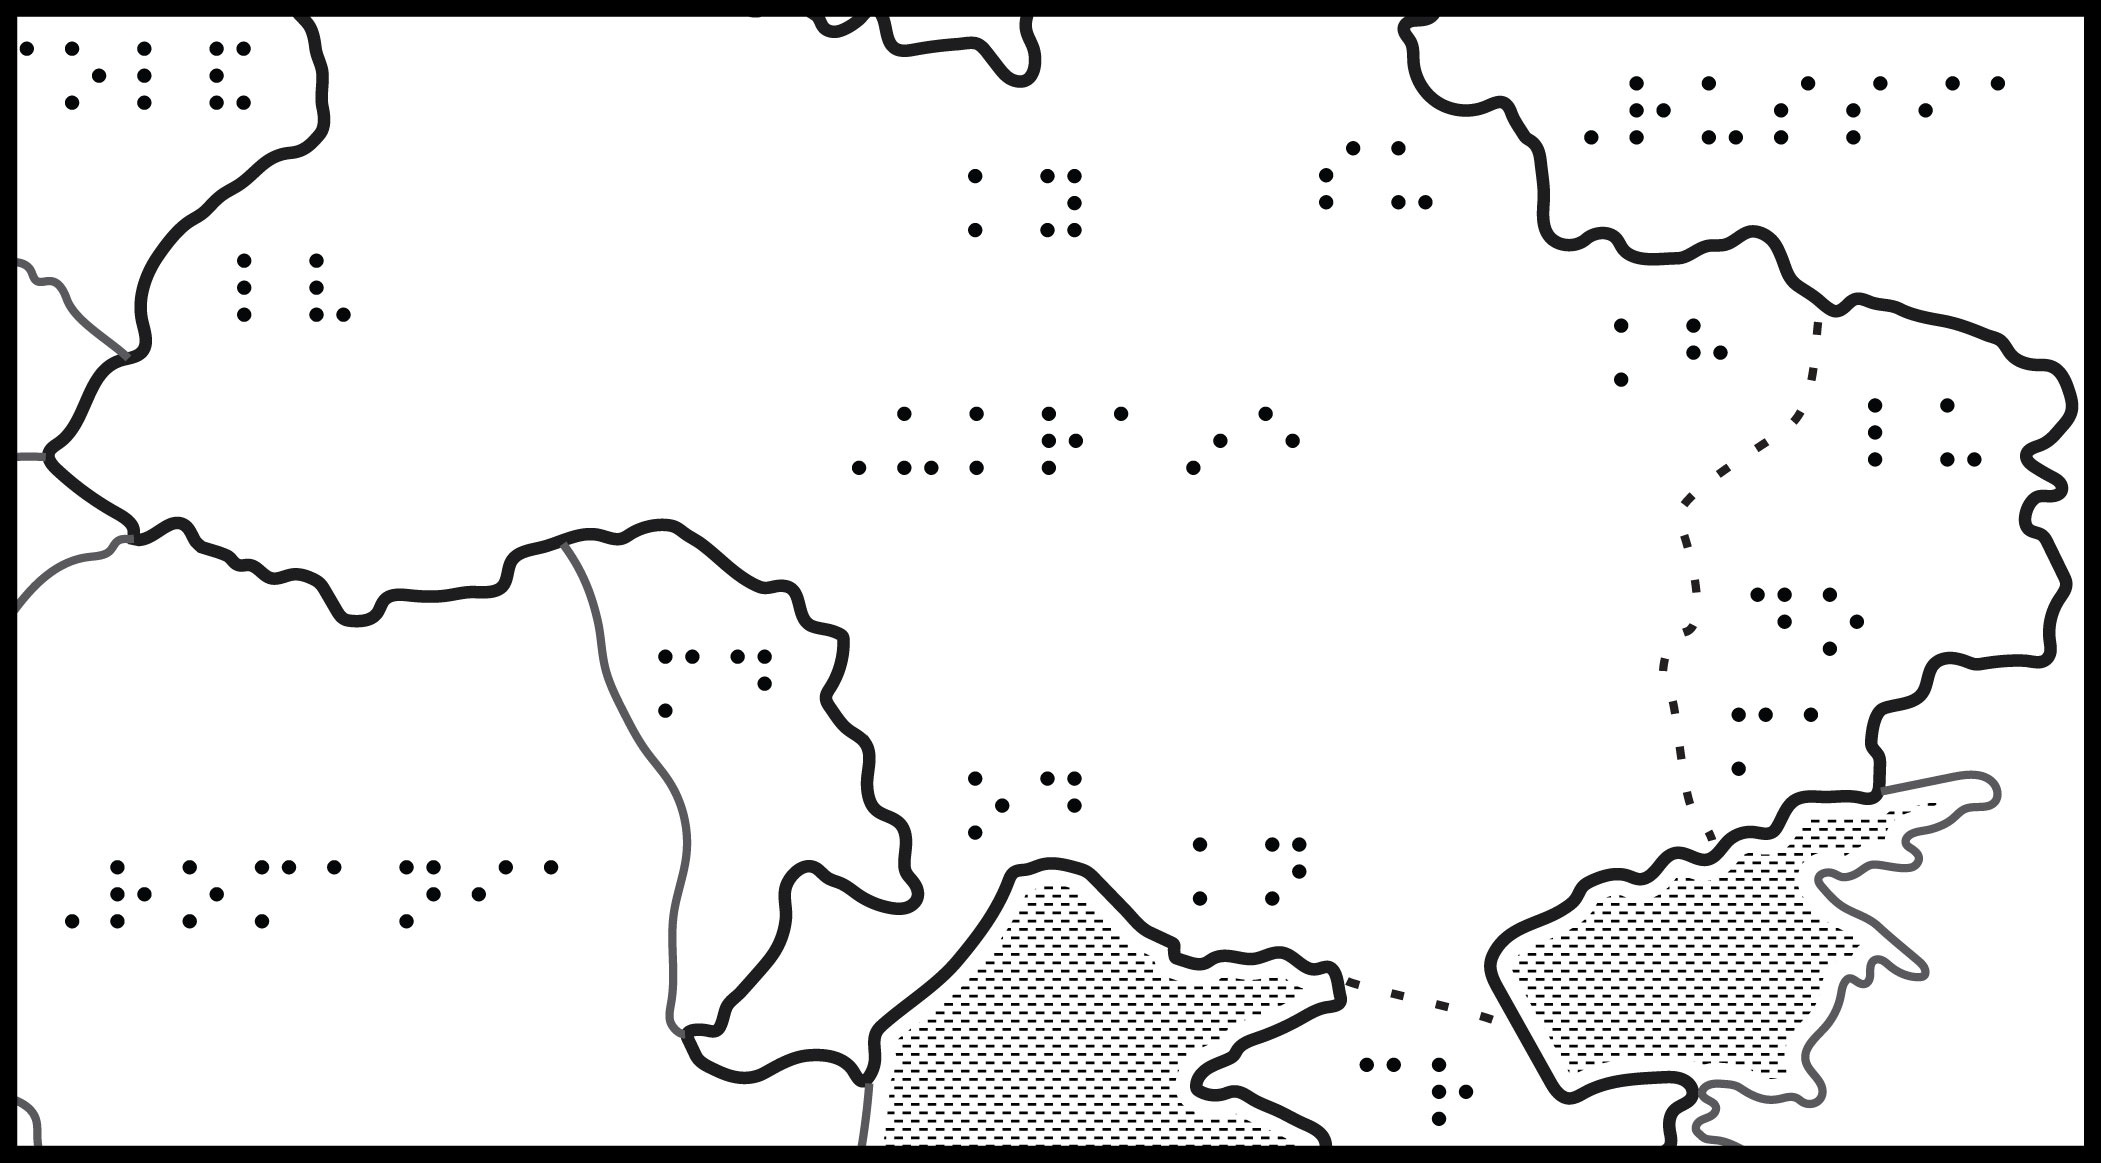
Map of Ukraine, relevant cities and regions
Title: Ukraine Map
Image Description: Map of Ukraine with bordering countries and prominent cities labeled. North is up; north arrow is omitted. Surrounding Ukraine, clockwise from the northeast, is Poland,...