Title: Gun Rights vs Gun Control Groups Spending
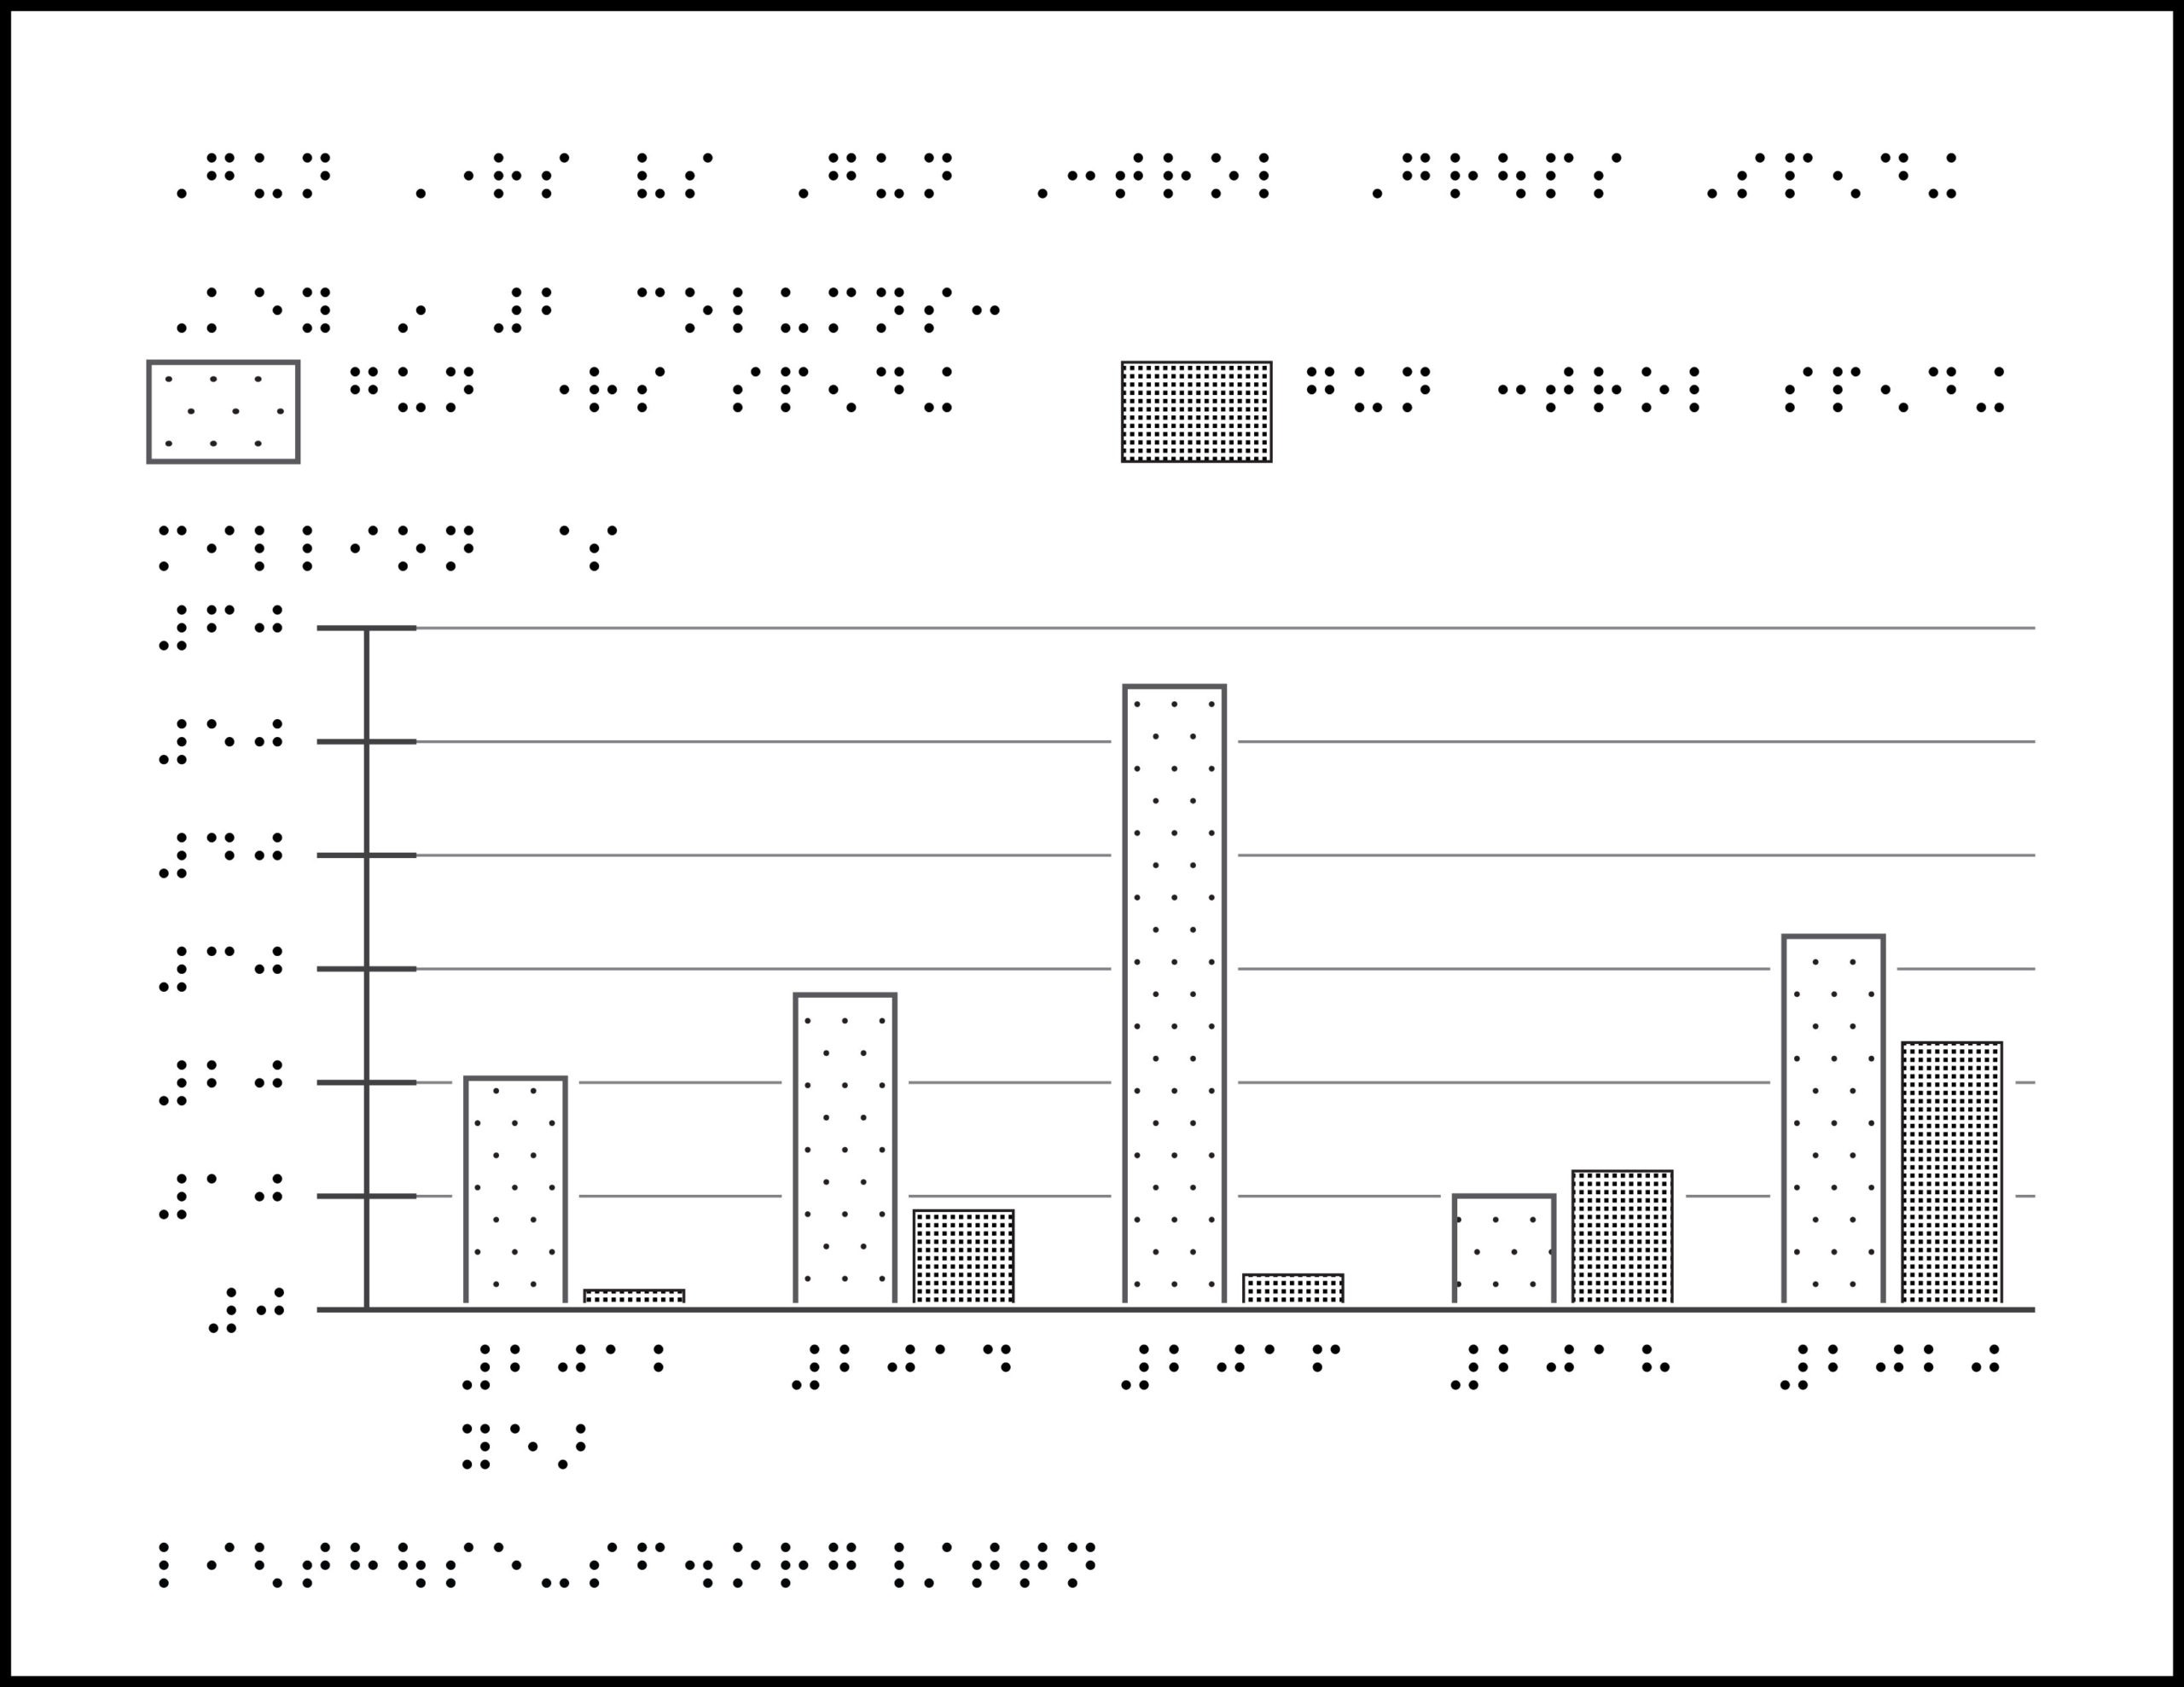
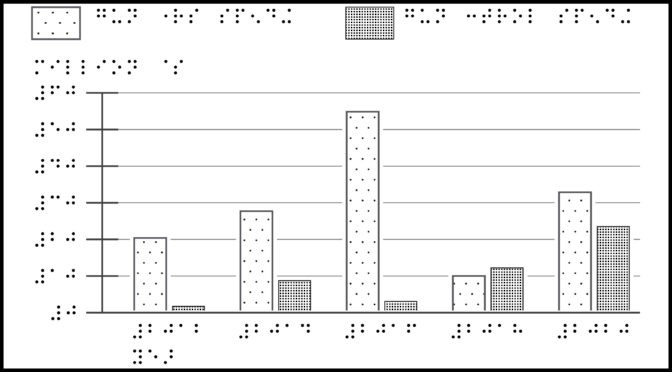
Image description: Bar graph with y-axis label “million $” and x-axis label “year,” with five pairs of bars comparing gun rights spending as the left bar and gun control spending as the right bar. The y-axis increases from 0 to 60 in increments of 10 million dollars. The year shows years 2012 to 2020. The trend for gun rights spending increases from 2012 to 2016, then decreases with a large dip in 2018. The trend for gun control spending increases from 2012, approaching gun control spending in 2020. Table with approximate amounts below.
| Year | Gun rights spending (approximate) | Gun control spending (approximate) |
| 2012 | $20 million | Less than $1 million |
| 2014 | $28 million | $9 million |
| 2016 | $55 million | $3 million |
| 2018 | $10 million | $6 million |
| 2020 | $32 million | $23 million |
ZIP folder contains files for producing tactile graphics on 8.5 x 11-inch paper, landscape:
- PRNs for ViewPlus Columbia / Delta, APH PixBlaster, IRIE BrailleTrac / BrailleSheet;
- PDFs for Swell, Microcapsule or PIAF;
- Reference PDFs with corresponding large print text (not for tactile production).
Printing Instructions and Supported Embossers
How to unzip/uncompress: Windows 10, Windows 8.1, MacOS.
Source: Chart titled “Gun rights groups have spent more than gun control groups in most recent years” from America’s gun culture – in seven charts, BBC News.
Submit Your Ideas and Touch The News
Sign up
Sign up to receive tactile graphics files to print at home.

